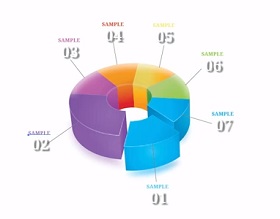
Diagrams and statistics are an essential part when you want to illustrate a complex project. This video tutorial shows you how to create a colorful 3D pie chart. We will be using Adobe Illustrator with the 3D Extrude and Bevel tools.
Related Posts
30
Nov2022

Modeling a Low Poly Killer Whale in Blender 3D
In this video tutorial we will see how to model a low-poly killer whale in Blender. An easy lesson to make an animal with a very simple and light geometry.…
02
Jan2016

Modelling Celtic Golden Ring in Autodesk Maya
This video tutorial shows how to style a Celtic-style gold ring with Maya. A complete lesson that with a few simple steps will make us obtain a beautiful 3D object.
15
Oct2018

Draw a Education Infographic Design in Illustrator
In this interesting video tutorial we will see how to create a vector graphic for school-themed information with a pencil as the main base using the Adobe Illustrator program. A…
12
Dec2015

Modeling a Christmas Ornament in 3ds Max
This video tutorial shows you how to shape Christmas tree balls. A very current exercise given that we are in full festive mood.
14
Oct2022

Draw a 3D Frying Pan whit Egg in Adobe Illustrator
This video tutorial shows you how to draw an egg frying pan in Adobe Illustrator. We will use various tools to give the subject a 3D look with the shades…
28
Oct2022

Simple Santa Claus Head Free Vector download
On this page you will find another free graphic element. This is a Vector Santa Claus Head that you can use on your graphic projects. The compressed file is in…